GuLoader’s Anti-Analysis Techniques
GuLoader is a VB5/6 shellcode-based downloader, with many anti-analysis techniques used to make our lives, as malware researchers, much harder. In this post, I’ll show you how I reversed engineer the loading mechanism and explain the different anti-analysis methods used.
Working with Visual Basic
Visual Basic isn’t the most pleasant language to reverse engineer. It interacts with only one DLL, MSVBVM60.DLL and has a different structure than C, C++ or any other famous programming language. Fortunately, IDA has an idc script written by Reginald Wong which parses the VB headers which identifies the form event functions.

Where’s VirtualAlloc ?
It isn’t new that VB malwares are sometimes used for injecting another malicious code (PE/Shellcode). So, I decided to set up a breakpoint at VirtualAlloc and see if this malware is also part of the group. And indeed, I noticed that a shellcode is being written into a newly allocated memory section.
Looking at the code in IDA didn’t see any reference toVirtualAlloc , which means that the function resolved dynamically. I located the function call in my debugger, and moved back to IDA to get a better understanding of what happened.
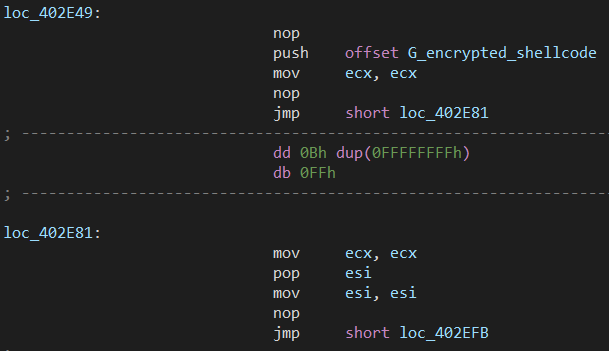
The first thing I’ve noticed is that the malware uses the following techniques in order to harden my analysis:
- High amount of
JMPs - Inflating redundant instructions, for example,
pushfdfollowed bypopfdandmov ebx, ebx - Obfuscated values using predefined calculations


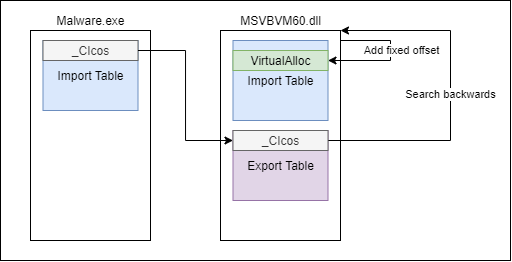
VirtualAlloc resolving process is:
- Calculate the address of the first import from
MSVBVM60.dll(as shown in the figure above) - Locate
VirtualAllocinsideMSVBVM60.dll's import table — this done by searching backward from the function address in step (1) to the magic value calculated in the figure above. Once, the base address found the malware adds hardcoded value of0x10CCwhich points toVirtualAllocimport table entry - Copy the address of
VirtualAllocfor the import table

Shellcode’s Decryption and Execution
The shellcode is stored encrypted inside a global variable, which is copied into the newly created section.

Then, the malware decrypts the shellcode:

At the end, the malware jumps to the new section address and starts executing the shellcode.
Shellcode Analysis
Looking at the strings inside the shellcode suggest that the shellcode also uses some kind of strings obfuscation and dynamic function loading/resolving:
C:\Program Files\Qemu-ga\qemu-ga.exe
C:\Program Files\qga\qga.exe
Mozilla/5.0 (Windows NT 6.1; WOW64; Trident/7.0; rv:11.0) like Gecko
Set W = CreateObject("WScript.Shell")\r\nSet C = W.Exec ("
Software\Microsoft\Windows\CurrentVersion\RunOnce
Msi.dll
wininet.dll
Publisher
kernel32
advapi32
user32
ntdll
shell32
windir=
msvbvm60.dll
\syswow64\
\METEROLO
Before continuing my research, I wanted to understand if and how the malware resolves those obfuscated strings and functions. I saw that the malware uses DJB hashing algorithm:


Using that hashing algorithm, the malware parses the PE headers of the requested DLL and look for the function name hash in the export table:

After labeling the function that is responsible for dynamic function loading and the hash function I was ready to move forward to reveal the different anti-analysis techniques used by the malware.
Anti-Analysis Techniques
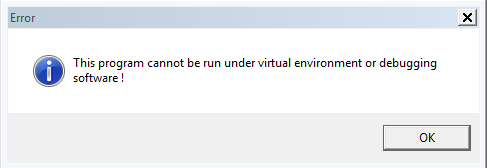
Running the malware without any changes will result with the following message:

And the malware will terminate itself.
How did it find out that it is running inside a VM or there’s a debugger attached?
#1 — VM Detection 1 — Memory Scan
The malware scans the process’s virtual memory address space using ZwQueryVirtualMemory WinAPI and uses pre-calculated string hashes (again, using DJB hash function).

Once the malware detects one of the following string hashes it will display the message box and terminate itself.
0x2D9CC76C
0xDFCB8F12
0x27AA3188
0xF21FD920
0x3E17ADE6
0xA7C53F01 \\ "VBoxTrayToolWndClass"
0x7F21185B \\ "HookLibraryx86.dll"
0xB314751D \\ "vmtoolsdControlWndClass"
#2 — VM Detection 2— Hypervisor Feature Bit
In this method, the malware utilizes thecpuid instruction with EAX=1 . This means that the result will be stored inside ECX and EDX , where the 31st bit of ECX register is the hypervisor feature bit.
The hypervisor feature bit indicate a hypervisor present, which means that this value is always zero for physical-CPUs.

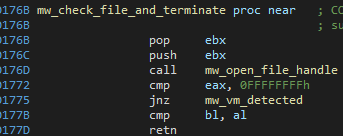
#3 — VM Detection 3— QEMU Guest Agent
The malware checks if QEMU related files exist on the infected system:

It searches in the following files:
- C:\Program Files\Qemu-ga\qemu-ga.exe
- C:\Program Files\qga\qga.exe
#4 — Anti-Sandbox 1 — RTDSC Wrapper
The rtdsc instruction is used to determine how many CPU ticks took place since the processor was reset, which can be used for Sandbox/VM detection mechanism.
In the case of that malware, as we can see at #2, if the readings are the same, the malware enters into an endless loop.
#5— Anti-Sandbox 2— Windows Enumeration
The malware uses EnumWindows WinAPI in order to count the top-level windows running on the system, if the number is lower than 12, it will call TerminateProcess.


#6— Anti-Sandbox 3— Long Delays
The malware calls to the same function many times in order to extend the execution time of the program before revealing its real intentions. For example,

This is technique used in order to evade sandboxes since they’re usually time-limited.
#7— Anti-Attaching— Patch Important Functions
The malware patches DbgBreakPointand DbgUiRemoteBreakin calls which are being used by debuggers and disrupting their actions.

Before patching the functions, the malware needs to change the page protection of ntdll.dll to RWX.
Then, the malware writes 0x90 (NOP) into DbgBreakPoint and kernel32!ExitProcess calls inside DbgUiRemoteBreakin.


#8 — Defense Evasion— WinAPI Function Hooks Removal
Security products (AV, EDR, etc…) usually insert JMP instruction in the first 5 bytes of WinAPI functions to execute their code before the real function being called. This allows them to have better control over the process’s actions.
The malware searches for known syscall patterns inside ntdll , for example, in the figure below we can see that the malware searches for the pattern:
B8 ?? ?? ?? ??
B9 ?? ?? ?? ??
8D 54 24 04
This pattern matches, for example, to ZwReleaseMutant function call:

As we can see, after the malware finds the pattern, it extracts the syscall number and restores the function call to its appropriate structure.
#9 — Anti-Analysis — Check Installed Software and Running Services
The malware utilizes MsiEnumProduct and MsiGetProductInfo functions in order to iterate over the installed software in the system.
For each installed software, the malware checks if the Publisher is inside its black list.

The same thing is done with running services:

The malware enumerates the running services and searches for the following service names hash (probably security products):
0x30871D6D
0xD03596C8
0x1B7912B2
#10— Anti-Debugging 1 — Protected Function Calls
The malware implemented a Win32 API function calls wrapper which perform checks before calling the actual function:

Using NtGetThreadContext , the malware checks if there are any hardware breakpoints (by inspecting the DRx registers values) and software breakpoint (represented by0xCC,0x3CD and0xB0F).
The arguments to the Win32API function pushed earlier to the stack.
#11 — Anti-Debugging 2— ThreadHideFromDebugger
The malware calls to NtSetInformationThread with THREADINFOCLASS.ThreadHideFromDebugger flag.

#12 — Anti-Debugging 3— ProcessDebugPort
The malware uses ZwQueryInformationProcess to detect if a debugger is attached to the process.

According to MSDN:
Retrieves a DWORD_PTR value that is the port number of the debugger for the process. A nonzero value indicates that the process is being run under the control of a ring 3 debugger.
Conclusions
GuLoader implements many anti-analysis techniques and uses different methods which makes the analysis harder. After reading this post you have the knowledge of how to overcome those techniques. Those techniques used in many other malwares which you now be able to identify in your research.
Hope you found this post useful :)
References
[1] http://sandsprite.com/vb-reversing/
[2] https://theartincode.stanis.me/008-djb2/
[3] https://en.wikipedia.org/wiki/CPUID#EAX.3D1:_Processor_Info_and_Feature_Bits
[4] https://www.dimva2019.org/wp-content/uploads/sites/31/2019/06/DIMVA19-slides-13.pdf
[5] https://www.crowdstrike.com/blog/guloader-malware-analysis/
